


August 2019 AppSec Intelligence Report
By Katharine Watson, Sr. Data Analyst and Data Scientist
September 19, 2019
This report summarizes Contrast Labs' analysis of real world application attack and vulnerability data from August 2019. It utilizes data from attacks that Contrast Security observed over the previous months and highlights the key trends found.
Developers, product owners, AppSec, and security engineers can use this information to better understand application security threats, adjust security controls, and improve their security posture.
Through reading this report on a monthly cadence, AppSec teams can gain a better understanding of the possible types and origins of attacks and attackers.
Visit our website to learn more about how Contrast Security continuously measures both vulnerabilities and attacks in parallel across your application portfolio.
KEY OBSERVATIONS
- In August, attackers seemed to be scanning broadly for potential victims than in previous months, with fewer attacks per application. Contrast Security saw a 47% decrease in total attacks compared to July after two months of steady increases. During this time there was a 19% increase in applications reporting attacks.
- 2% of these attacks were connected to a vulnerability within an application. The other 98% were probes and did not connect with a corresponding vulnerability within the target application -- a striking fact for security teams using tools that cannot distinguish between ineffective and effective attacks.
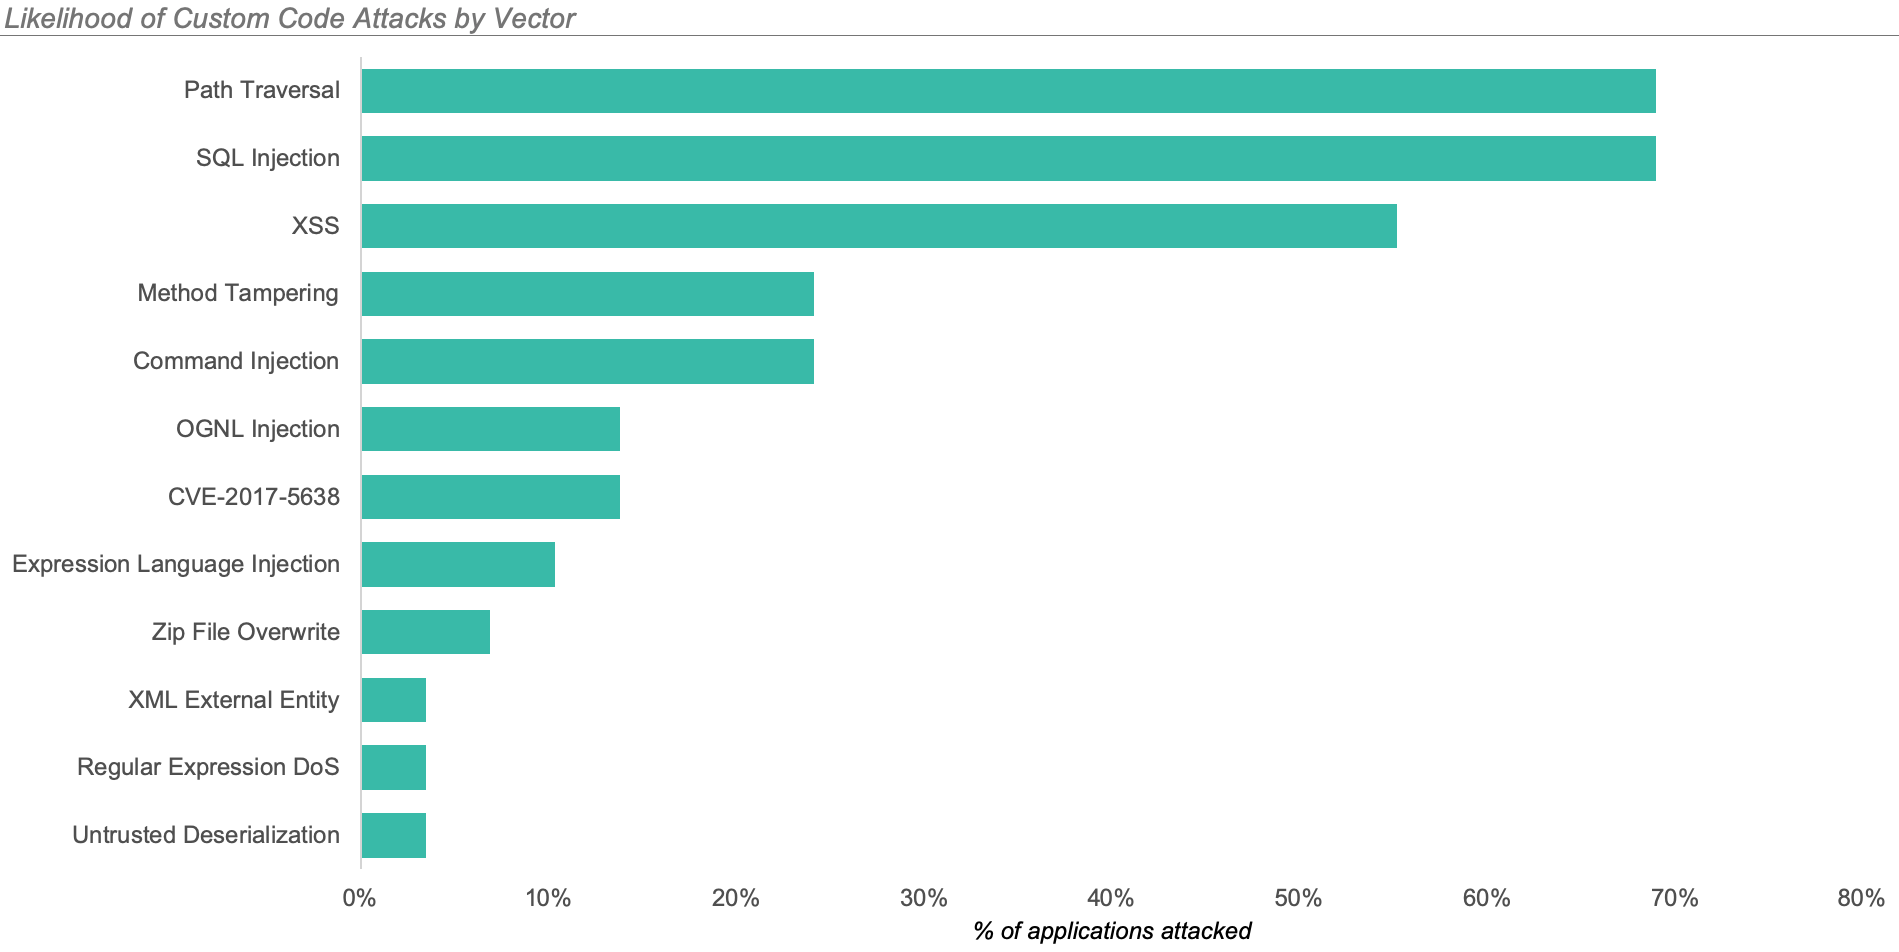
- The most common attack types were SQL Injection, Reflected Cross-Site Scripting (XSS), and Path Traversal.
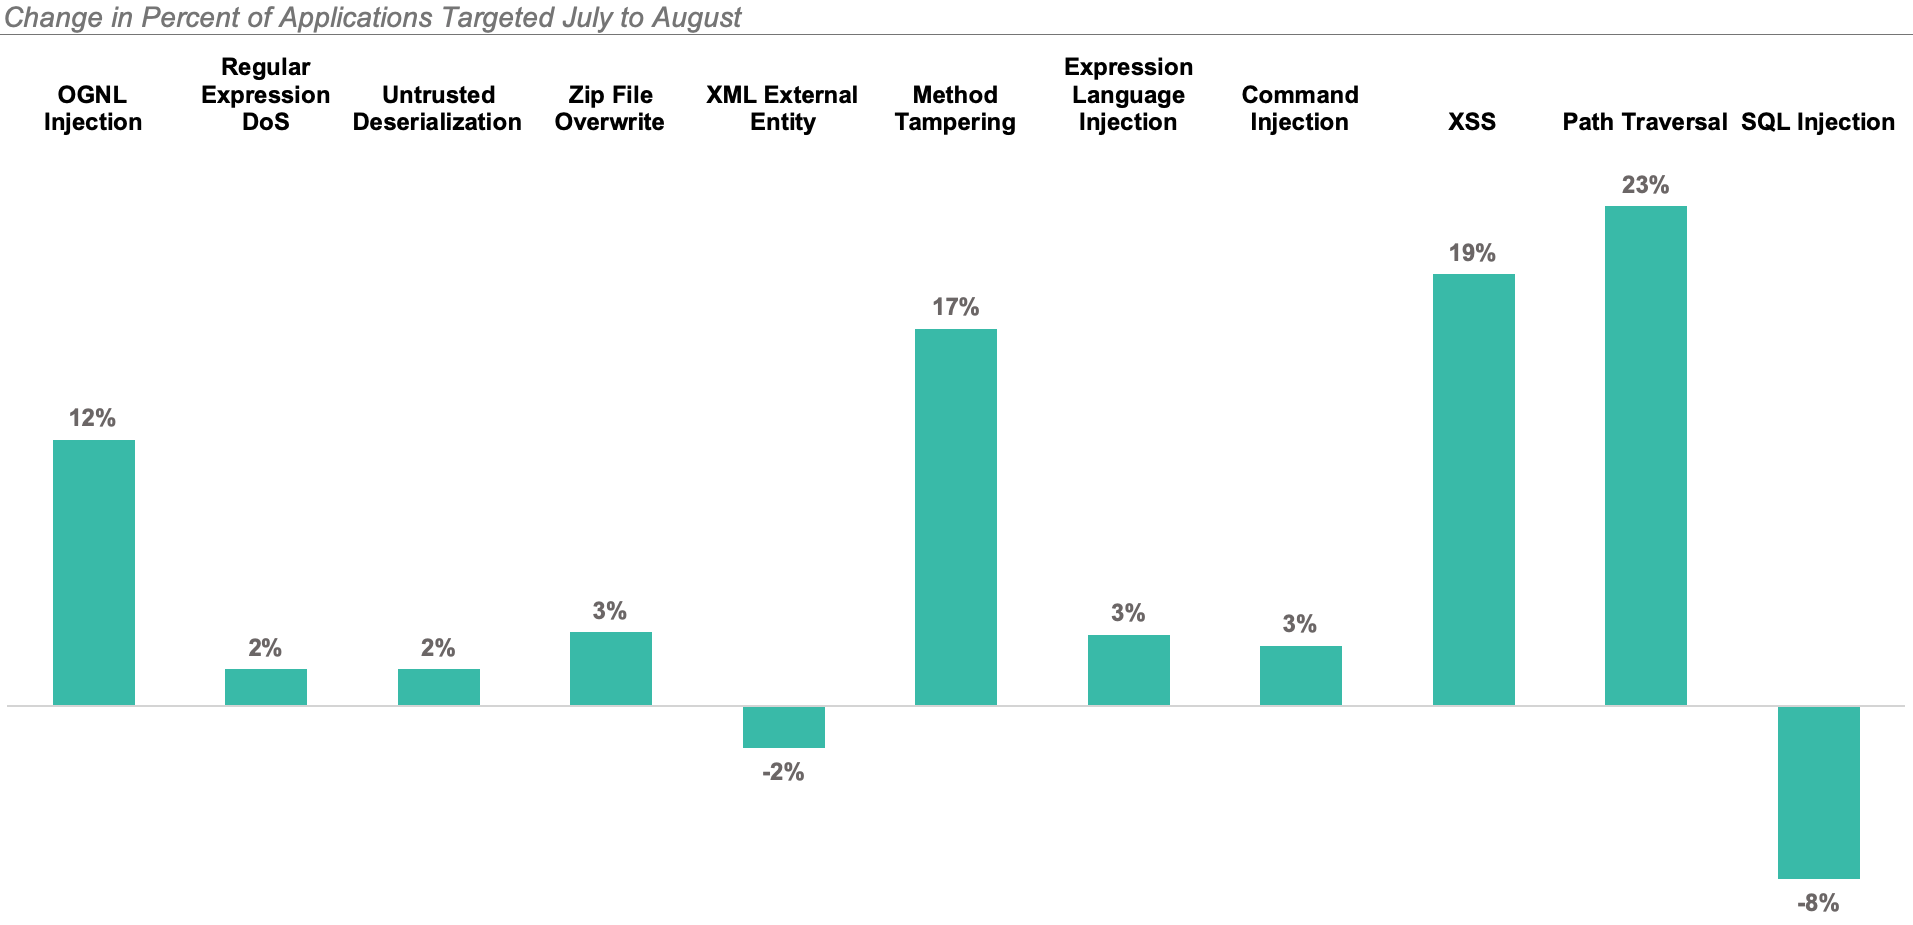
- The volume of attacks targeting open source components more than doubled compared to July levels, with a Struts2 attack (CVE-2017-5638) as the most common CVE attacked. It represented the 7th most common attack type in July. When exploited, CVE-2017-5638 allows the application executes untrusted injected code.
SUMMARY
- Custom Code Attacks: We saw the continued dominance of SQL Injection attacks last month. SQL-Injections represented 55% of all attack vectors, targeting 69% of applications.
- Open Source (CVE) Attacks: Attacks on CVEs, particularly Struts, continued at similar levels as last month. The most common CVE attack in August was CVE-2017-5638 (Struts 2 Input Validation).
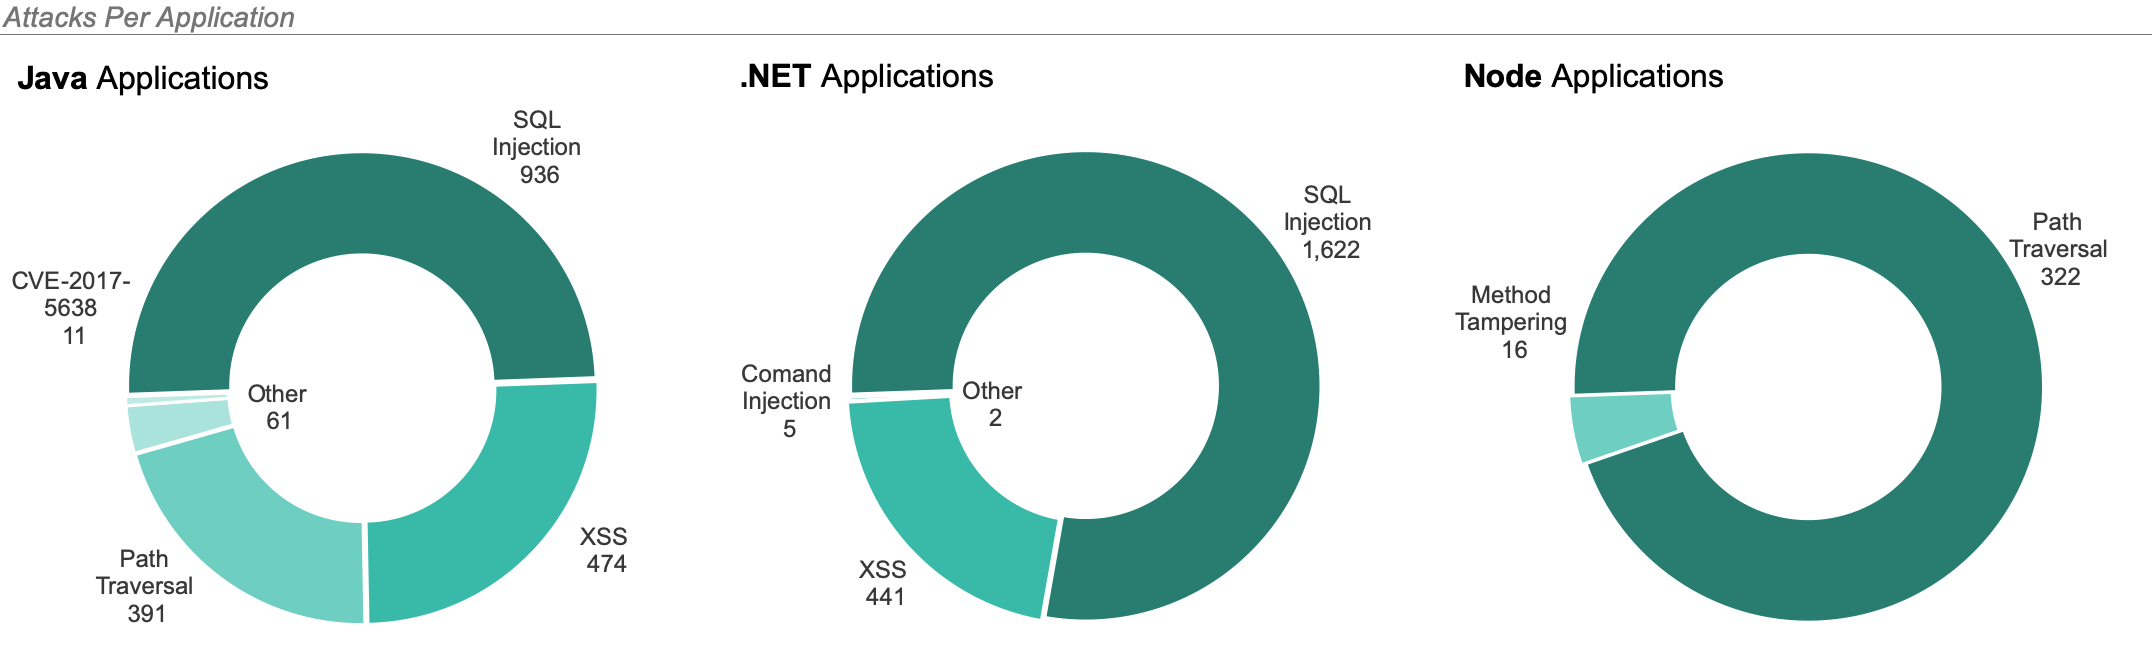
- Attack Vectors By Language: SQL Injection attacks were the most common attacks for both Java and .NET applications in August. Node experienced the highest volume of Path Transversal attacks.
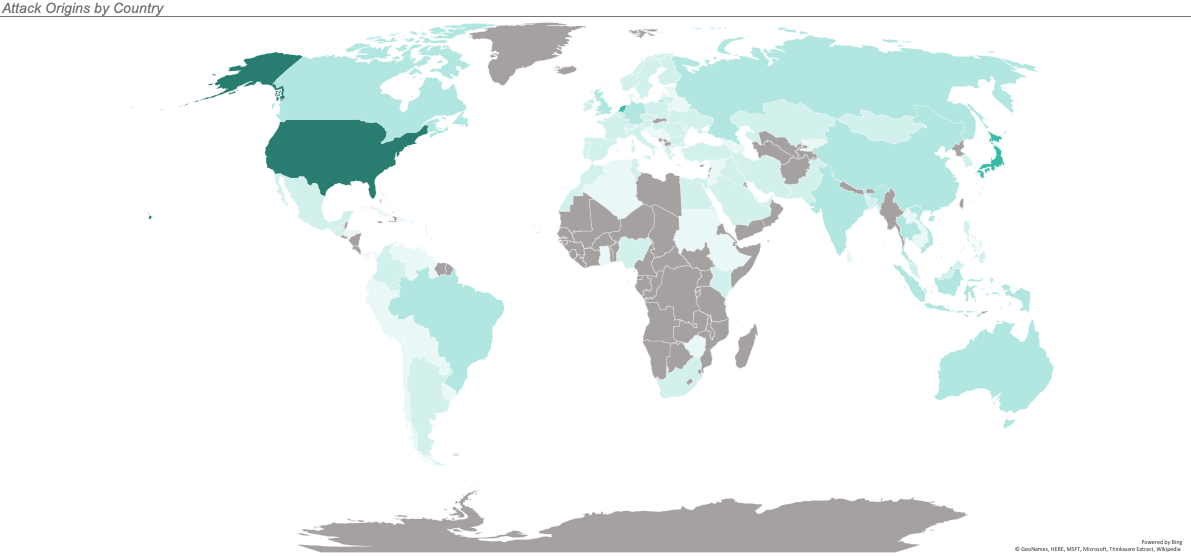
- Geo Location: Attacks originated across the globe in August, with the most attacks originating from North America, specifically the United States. Netherlands remained the second most common origin country, though attacks originating from the country fell by 50% compared to July.

CUSTOM CODE ATTACKS
The three most common attack types in August:
- SQL Injection
- Carefully crafted inputs that can alter the SQL queries the application uses, and steal data or execute code.
- Represented 55% of all attacks in August, down from 68% of attacks in July.
- Targeted 69% of applications.
- Reflected Cross-site Scripting (XSS)
- A web application vulnerability that allows users to run arbitrary JavaScript in other user's browsers.
- Represented 25% of attacks in August, up from 8% in July.
- Targeted 55% of applications.
- Path Traversal
- A vulnerability that allows users to control which files are opened and read by an application.
- Represented 17% of all attacks in August, up from 13% of attacks in July.
- Targeted 69% of applications.
In August, 97% of applications were targeted by one of these three types during the month.
TOP CVE ATTACKS
Exploiting vulnerable versions of Struts 2 continued to dominate attacks on CVEs. CVE-2017-5638 (Struts 2 Input Validation) attacks remained the most prevalent attack on a CVE. We observed a 40% increase in the attacks on this CVE from July to August.
While libraries constitute the largest percentage of application source code, attacks on custom code vulnerabilities continued to greatly surpass those on CVEs. This highlights the need for security teams to know about and properly manage the vulnerabilities within their custom code.
TOP ATTACK VECTORS BY LANGUAGE
ATTACKS BY GEOLOCATION
August saw attacks from 6 continents and 109 countries.
The greatest number of attacks originated from the United States, Netherlands, Japan, India, and Viet Nam, in descending order.
The map below illustrates the number of attacks originating from each country with the most saturated color representing the most attacks and the least saturated representing the least attacks. We observed no attacks from the countries filled in gray.

Katharine Watson, Sr. Data Analyst and Data Scientist
Katharine brings a wide range of analyst experience to Contrast. She has a history of devouring large data sets to discover knowledge and produce compelling narratives for a wide range of audiences. She is focused on using data to help tell Contrast’s story. Before joining the Contrast team, Katharine worked as an analyst, consultant, and project manager in both the private and non-profit sectors.
Loving our content? Subscribe now!
Get the latest application security news, trends, tips and insights content from Contrast directly to your inbox. By subscribing, you will stay up to date with all the latest and greatest from Contrast Security.