X
July 24, 2020
Analyzing data captured from June 2019 to May 2020, Contrast Labs found that applications experienced over 13,000 attacks on average each month over the past year. Serious vulnerabilities plague more than one-quarter of applications and 11% have six or more serious vulnerabilities. And the numbers of vulnerabilities continue to increase: The Top 5 vulnerabilities experienced an average increase in attacks of 60% this past year.
This poses a serious risk that must be solved by compressing mean time to remediation (MTTR). But MTTR shows organizations struggle to keep up. Those with more security debt (viz., more unremediated vulnerabilities) are falling farther behind and experience higher volumes of vulnerabilities—1.7x higher than for organizations with below-average security debt. The outcome is a continuous escalation in application security risk.
Most enterprises are in an all-out push to embrace digital transformation. Those businesses that were largely “sitting on the sideline” or simply “dipping a few toes in the water” have suddenly realized in the face of COVID-19 lockdowns that digital innovation may be the differentiator between viability and insolvency. Initial research shows that organizations are doing more than recognizing the need but also taking action: Budget and resource allocations for DevOps initiatives are up for the majority of businesses, despite an unprecedented economic downturn.
Intended outcomes around all this focus on application development include differentiated customer experiences, new revenue opportunities, lower costs, and improved productivity. But all of this activity has not gone unnoticed. Cyber criminals see the increased exposures more applications and more application programming interfaces (APIs) offer and are ramping up their attacks and becoming increasingly more sophisticated in how they are exploiting application vulnerabilities. Verizon revealed that 43% of data breaches this past year were the result of application vulnerabilities. On a similar note, Forrester found that 42% of firms that experienced an attack this past year said it was carried out by exploiting a software vulnerability.
Obviously, this is not a time to give application security short shrift. It is a time to double down.
Contrast’s “2020 Application Security Observability Report: Connecting Vulnerability and Threat Analysis with Real-world Implications in Applications and APIs,” which is based on data and analysis from Contrast Labs, drives home this point. It provides development, security, and operations leaders with actionable insights—guidance around vulnerability management, attack trends, open-source framework and library risks, and remediation targets.
The report is one of a kind, combining vulnerability, attack, and open-source telemetry data reported from applications in development through production. Following are some key findings and insights from the report, though certainly not a comprehensive list (you will need to download the full report for those).
Contrast Labs aggregated data concerning application vulnerabilities from multiple angles. Vulnerability trending and clustering highlights areas that require prioritization and those that offer the “lowest-hanging fruit.”
Applications offer bad actors a broad attack surface. Nearly all (96%) applications have at least one vulnerability, and 26% of them have one or more serious (either high or critical) vulnerabilities. Over 1 in 10 have six or more serious vulnerabilities.
Two vulnerability categories dominate applications in terms of prevalence (over half have one of these vulnerabilities)—insecure configuration and sensitive data exposure. But when serious vulnerabilities are examined, a different list forms—cross-site scripting, broken access control, and injection.
A deeper dive into applications with serious vulnerabilities reveals a higher concentration of certain types of vulnerabilities: expression language injection, insufficient logging and monitoring, NoSQL injection, and unsafe data handling. For applications with expression language injection and insufficient logging and monitoring, there is a median of five instances of those vulnerabilities per application. In the case of vulnerabilities with NoSQL injection and unsafe data handling, the median rate of occurrence is four.
Clustering of serious vulnerability categories in applications with serious vulnerabilities could be good news for developers, as a single code change can potentially address multiple instances of a vulnerability within one application or even across applications.
The OWASP Top 10 offers development and security teams a list of vulnerabilities—based on broad consensus—that present the greatest security risk. However, OWASP does not rank them per the risk they pose nor categorize them based on level of severity. As a result, Contrast built severity ratings into its DevOps-Native AppSec Platform, knowing that enterprises need this information in order to prioritize vulnerability management—with severity levels based on vulnerability impact and likelihood.
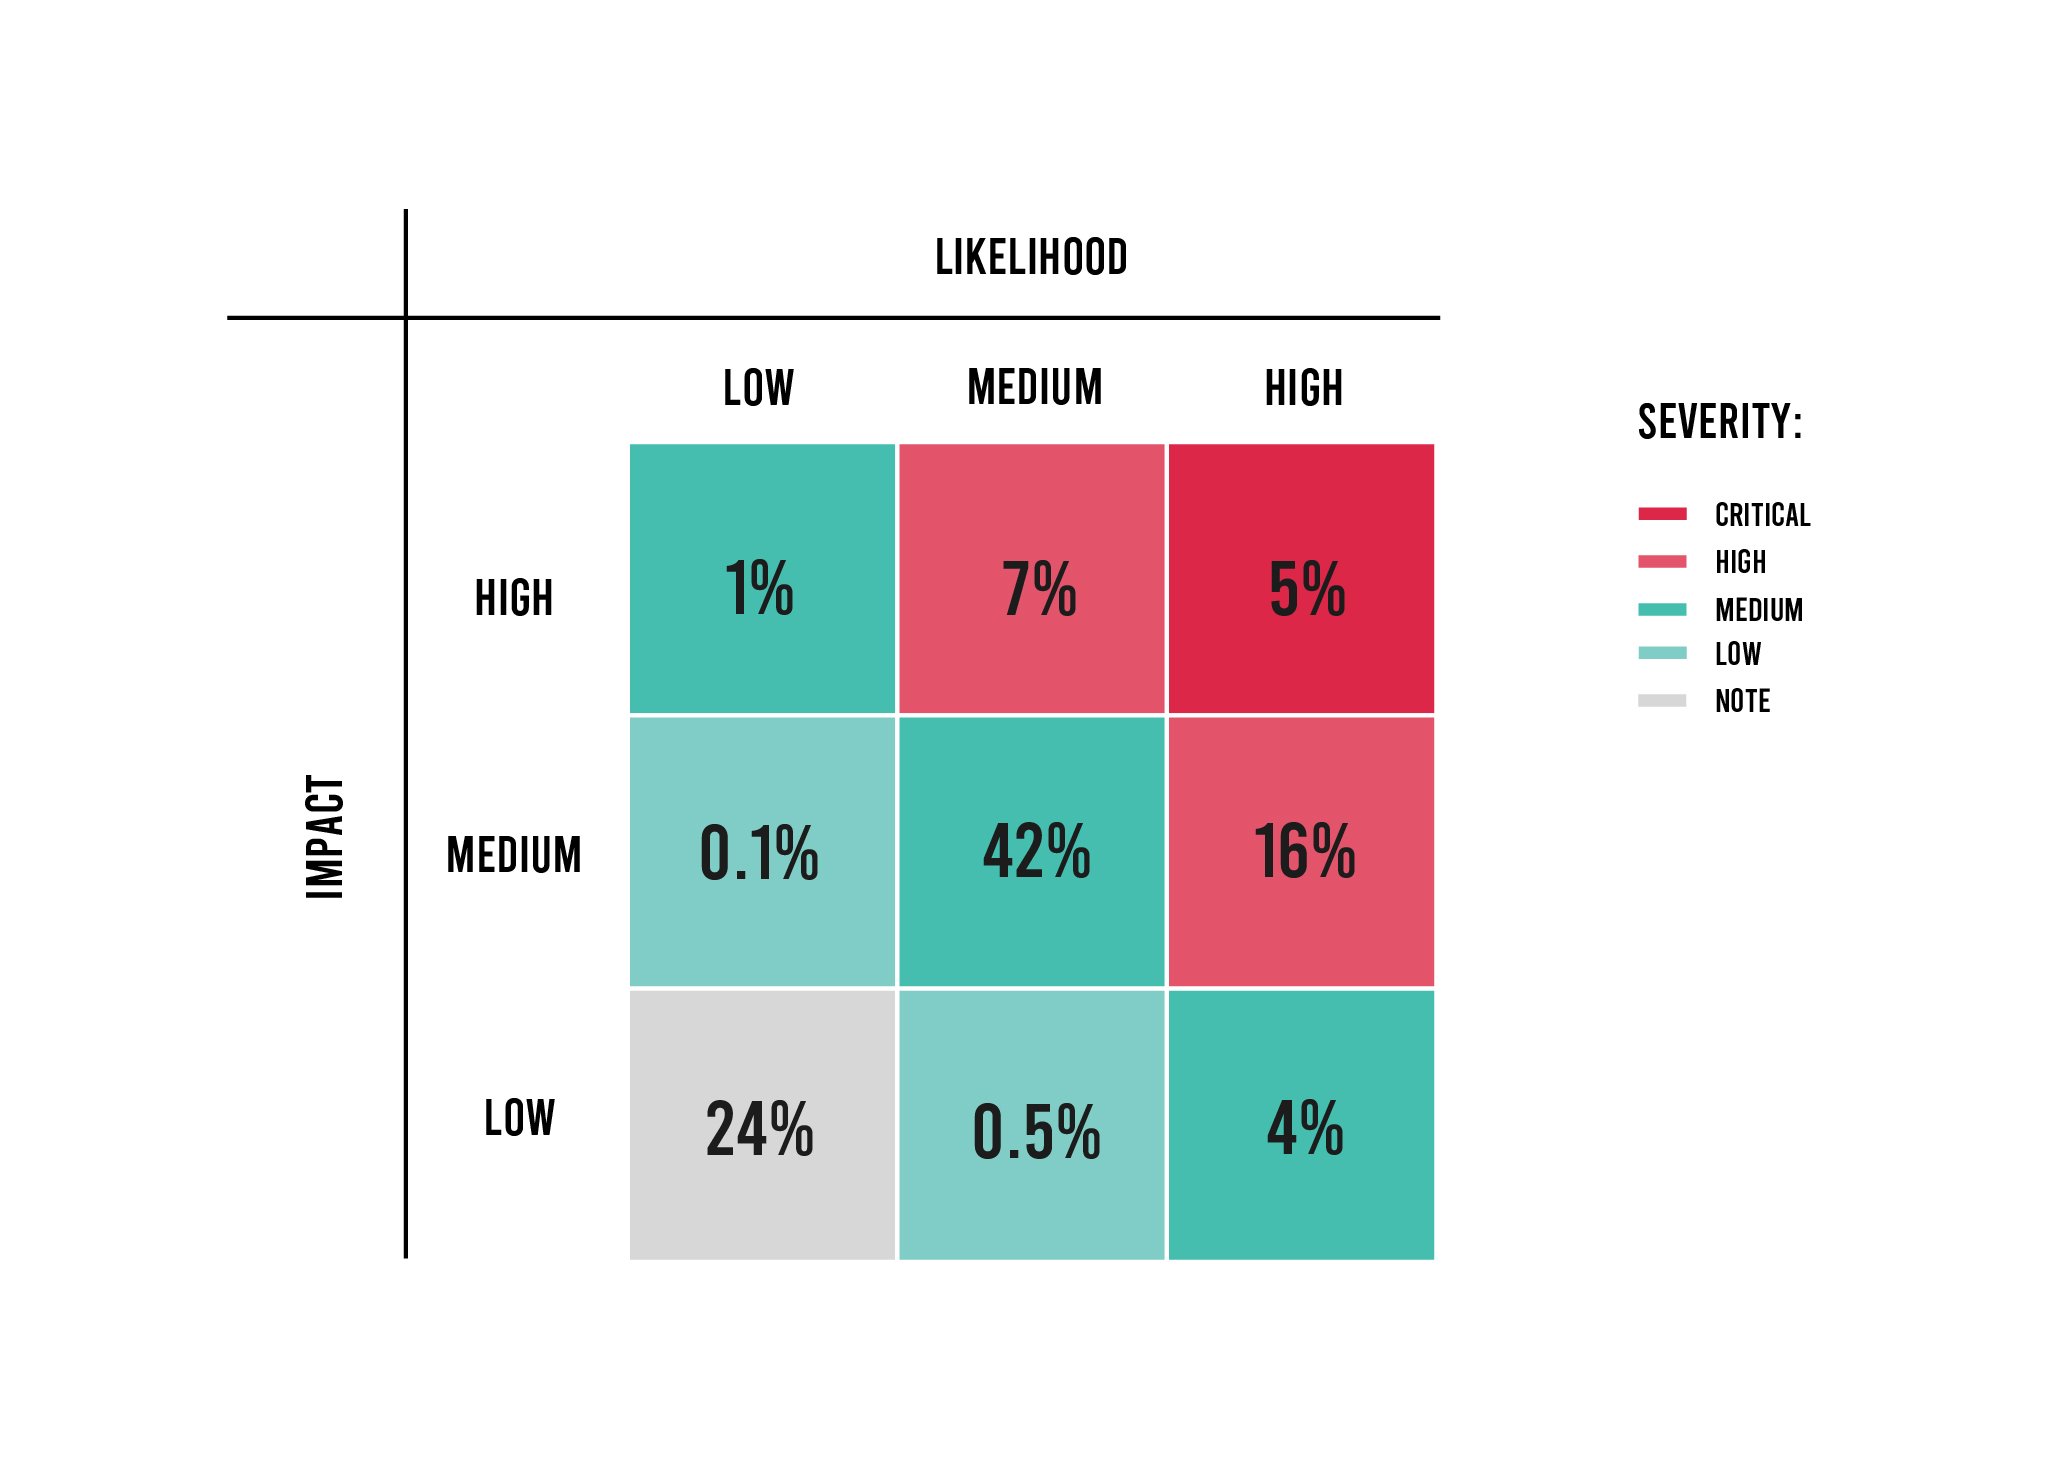
On that note, vulnerabilities in the “2020 Application Security Observability Report” pinpoint 28% of vulnerabilities as either high or critical—which are categorized as serious in the report. This obviously should be prioritized for remediation. Another 42% fall into a second-prioritization tier; vulnerabilities with medium risk in terms of both likelihood and impact. All other vulnerabilities fall into a tertiary-prioritization tier (30%).
The report also analyzes vulnerabilities across languages and industries. In regard to the former, the data shows that applications written in Java are more than twice as likely as .NET and .NET Core applications to have a serious vulnerability—42% compared to 16% and 20%, respectively. Plus, 18% of Java applications have at least six serious vulnerabilities versus 7% of .NET applications.
Government and financial services have the largest proportion of vulnerabilities, 36% and 32% respectively. Government entities tend to use older technology and outsource development to third parties, which are likely reasons for a higher vulnerability rate in the sector. One might assume that financial services would be the opposite mirror of government. However, financial services tends to be on the bleeding edge of innovation and tries new technologies that have not been tried before. Plus, financial services firms typically have a much larger inventory of applications and APIs.
As the aforementioned Verizon and Forrester research demonstrates, applications are in the crosshairs of cyber criminals with successfully breaches rapidly increasing. Contrast Labs discovered nothing to rebut these external trends. To begin, cyber criminals are cranking up their volume. Of the top five vulnerability attacks, attack volume rose an average of 60% over the past year.
Second, each application was targeted with an average of 13,279 attacks each month. Injection tops the list of vulnerability attacks, with 85% of applications with at least one attack probe or attempted exploitation. Nearly 8 in 10 Java and .NET applications experienced an injection attack. Beyond injection attacks, broken access control and cross-site scripting attacks targeted a majority of applications.
The good news is that 98% of attacks fail to reach a vulnerability that is present in a given application. But that 2% success rate is still dramatic and should pose a serious concern for any organization.
Open-source frameworks and libraries offer developers the means to accelerate release cycles and drive enhanced efficiencies. This is resulting in a rapid adoption of open source by developers. For example, a study from Forrester recently found the use of open-source code jumped 40% over the past year.
As this pile of open source grows, so does the pile of vulnerabilities. To begin, the number of vulnerabilities logged in the Common Vulnerabilities and Exposures (CVE) database is skyrocketing at an unprecedented clip. Yet, there is some good news on that front: Per the analysis by Contrast Labs, 56% of open-source frameworks and libraries in applications are never invoked and create almost no risk. This dramatically winnows the size of the vulnerability haystack for developers.
In terms of languages, Java exhibits a significantly higher level of risk in the use of open source. Managing security debt is a problem; of the top 10 Java libraries in use, nine of them use at least a version that is a dozen versions behind the latest revision. .NET is slightly better. When it comes to the severity of the top 10 CVEs, 9 of the top 10 Java CVEs are 9.8 or higher. However, .NET is significantly lower, with all of the Top 10 .NET CVEs with a score below 7.6.
There is a direct line between the time to remediate and an organization’s risk posture. As vulnerabilities are remediated faster—especially those that are serious—the risk posed by the application attack surface diminishes. Plus, as security debt increases, the amount of risk grows at the same time. And if those vulnerability fixes get pushed to late in the development cycle or even production, time and cost explode.
Contrast Labs found that Contrast customers achieve a median time to remediate all vulnerabilities at seven days and serious vulnerabilities at one day. Within three days, they remediate 45% of all vulnerabilities and 62% of serious vulnerabilities. When compared to static application security testing (SAST) median time to remediate, Contrast Labs found Contrast customers reached critical milestones much faster: 51% in seven days versus 16% for SAST, 55% in 14 days versus 21% for SAST, and 61% in 30 days versus 29% for SAST. At one year, Contrast customers have 10.3% of all vulnerabilities and 2.3% of serious vulnerabilities unremediated, whereas SAST still has 29.4% of vulnerabilities still not remediated.
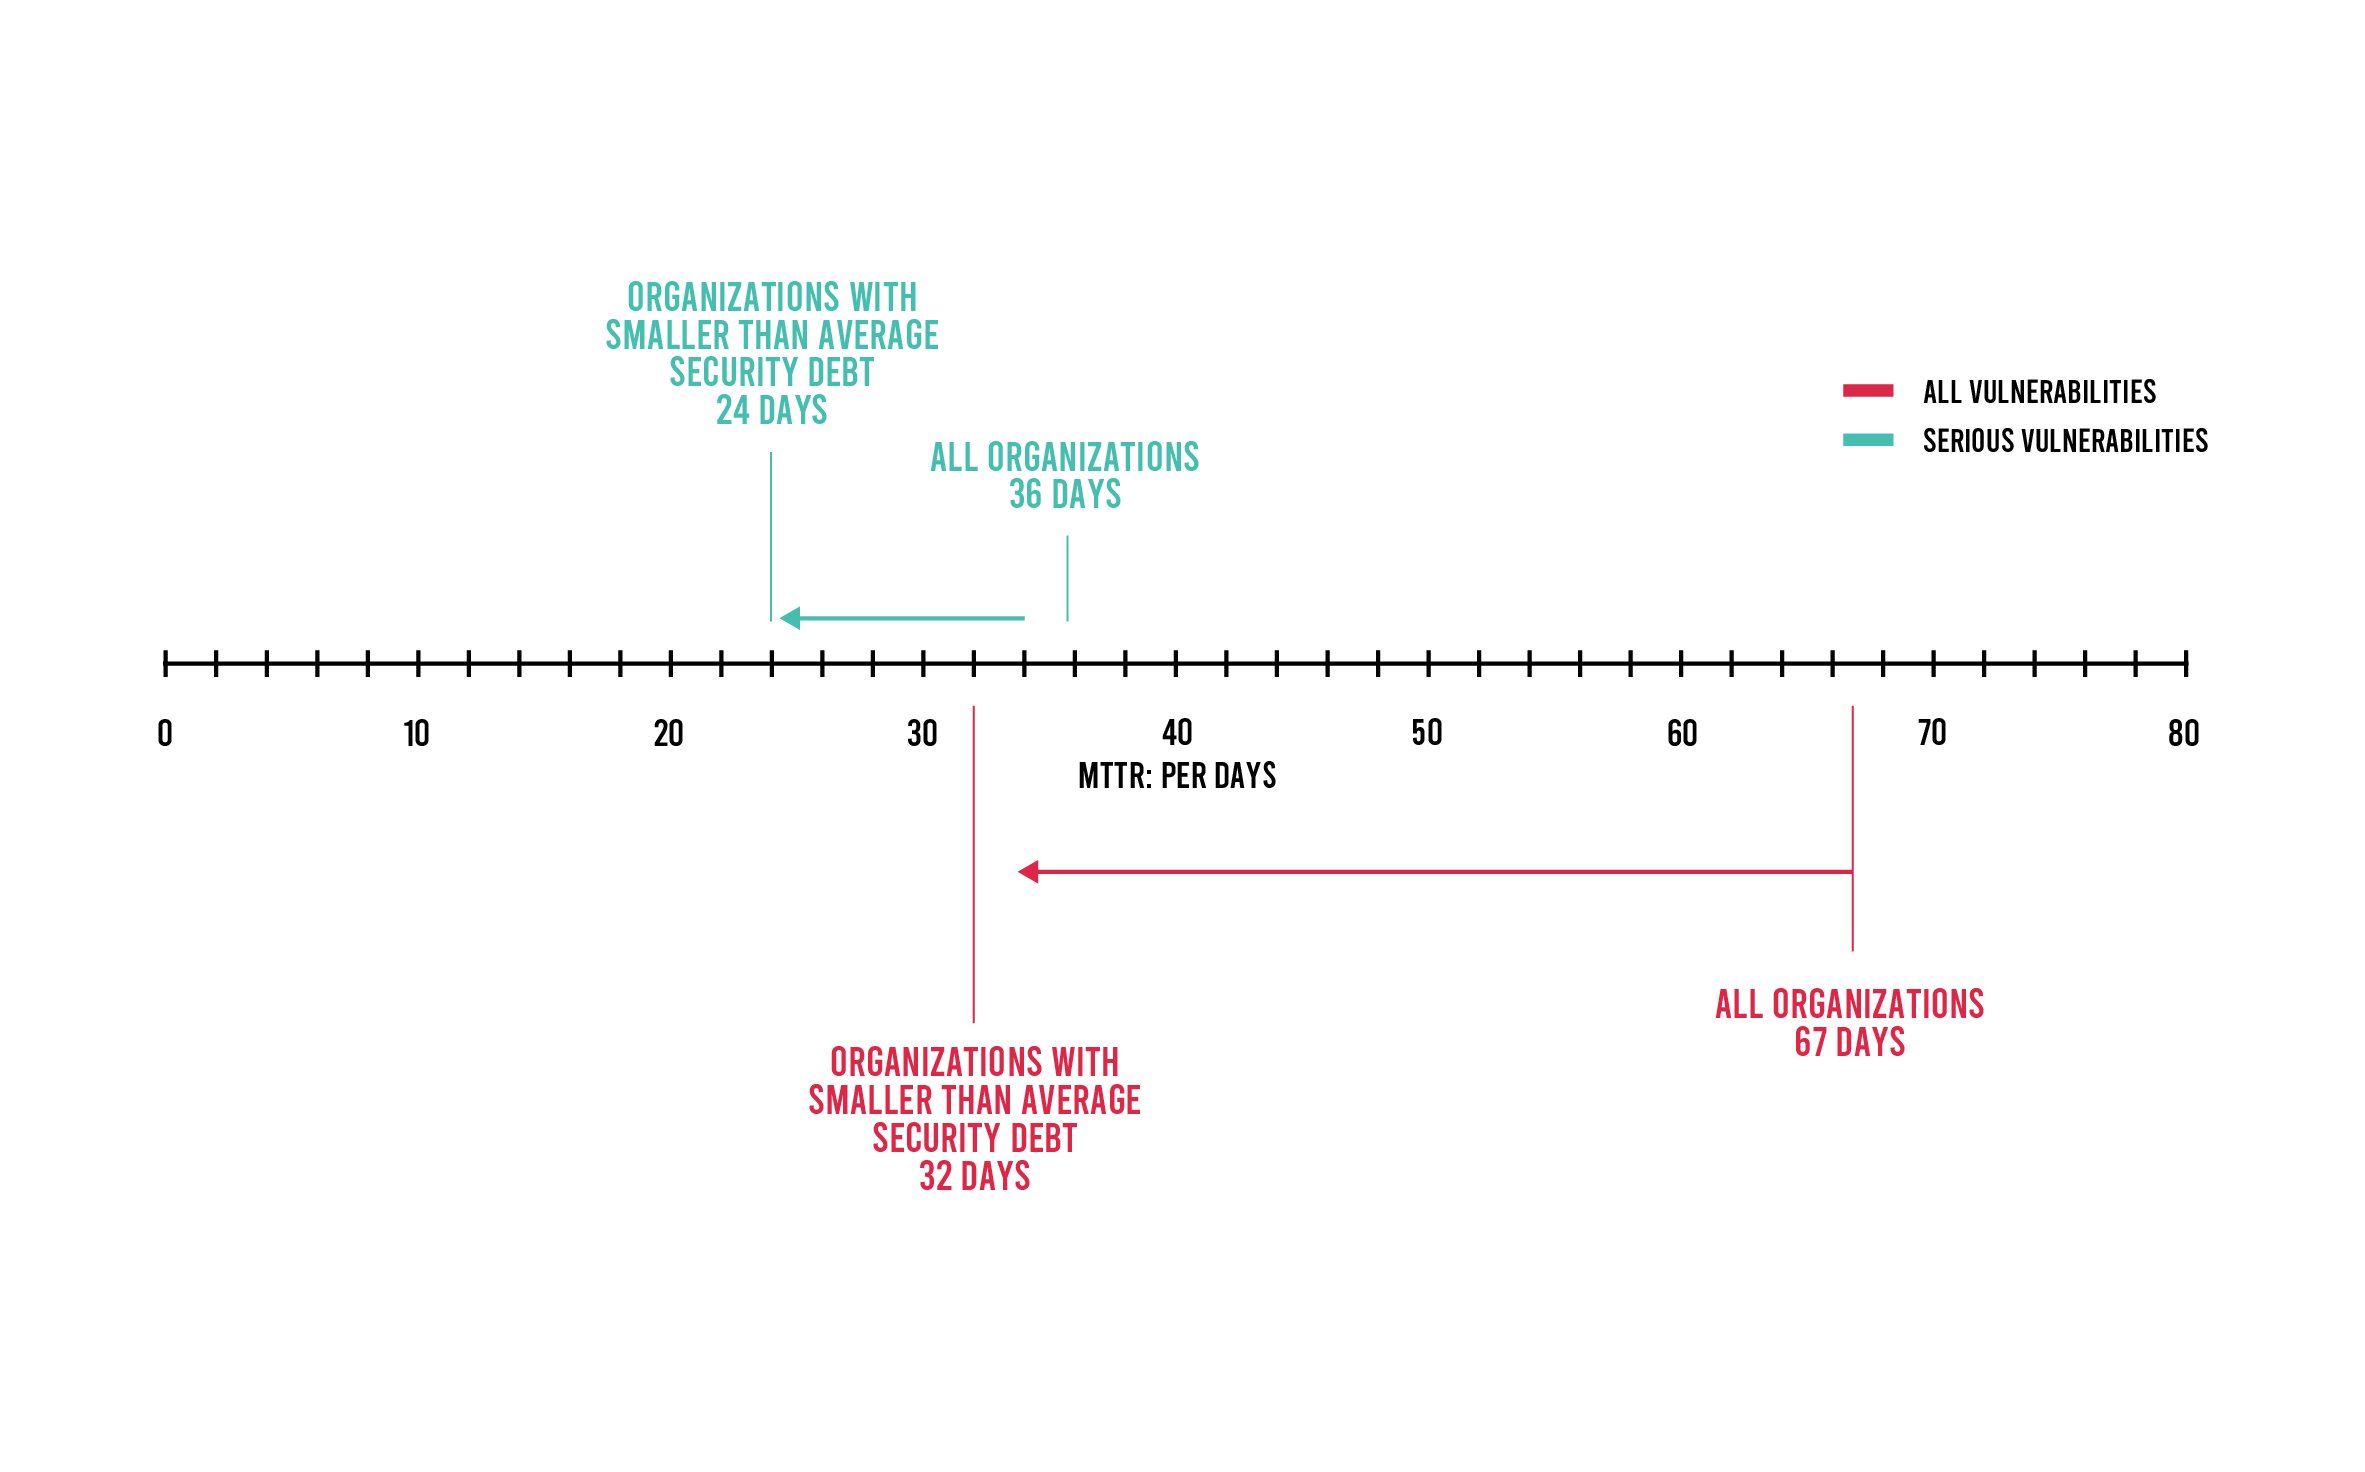
All of this translates into higher risk—particularly as security debt increases (viz., the longer MTTR, the greater the likelihood of a successful attack). Contrast Labs compared customers with smaller backlogs on average with all customers and found that those with below-average security debt achieve significantly faster time to remediate. For example, 75% of vulnerabilities are remediated by those with below-average security debt 21x faster than the average organization—8 days to 175 days. While not as dramatic, the same is true for serious vulnerabilities: 75% of serious vulnerabilities are fixed in five days for those with below-average security debt versus 16 days for the average organization. Overall, Contrast Labs discovered that organizations with more security debt continue to fall further behind and experience higher volumes of vulnerabilities—1.7x higher for organizations in general versus those with below-average security debt.
As the number of applications and APIs in development and production grows and the volume, velocity, and sophistication of cyberattacks increases, the challenges in protecting applications intensifies. If this report from Contrast Labs proves anything, it is the fact data is critical and should inform and guide how an organization manages vulnerability remediation. Knowing what vulnerabilities matter and do not matter, what attacks are targeting and not targeting, and what open-source code is at risk or not at risk is invaluable information.
Preventing data breaches and operational outages that are the result of an application vulnerability is a key objective for any application security program. But others exist—from ensuring security keeps pace with accelerating development cycles to improving the efficiencies of development, security, and operations teams. Finding and implementing the right application security solutions that shift application security testing left while extending those same integrated protections into production enables organizations to achieve the level of prioritization, visibility, and accuracy modern software demands today.