X
February 10, 2021
As we look back on 2020, I think we all would agree that it was a year like no other. What we now know is that for many of the same months we were working from home and experiencing myriad other disruptions in our lives, state-sponsored cyber criminals were moving laterally within the SolarWinds network, altering that company’s software in such a way that they likely had advanced access to more than 18,000 networks that use the company’s IT management suite—including multiple U.S. federal government agencies that handle top-secret information.
This attack was disclosed in mid-December, right when the critical mass of media attention was focused on the aftermath of the U.S. presidential election and consumers were finalizing their holiday shopping. As a result of this timing, I think many casual news consumers missed the magnitude of the event—if they heard about it at all. Despite this low level of awareness in the general public, experts say this hack was among the worst of the past decade.
The application attack on SolarWinds impacted federal agencies, including the White House and the Departments of Defense, State, Homeland Security, Treasury, and Energy (including the National Nuclear Security Administration). State and local government systems were also impacted, as were major private corporations like Microsoft, Cisco, Intel, and Deloitte. Along with IT systems at these and other organizations, the hack may ultimately impact connected operational technology (OT) systems—including the electronics that run critical infrastructure like the country’s electrical grid and power generation infrastructure.
If this event is not a wake-up call for organizations to prioritize application security, I don’t know what it would take. As Contrast Labs has been reporting all year in its bimonthly Application Security Intelligence Reports, cyber criminals did not slow their operations during the COVID-19 pandemic. In fact, in some ways, they have ramped up their activities to take advantage of the disruption we have all experienced. In the newly released Application Security Intelligence Report for November–December 2020, we note that a higher percentage of applications had serious vulnerabilities than in September–October. And that translates into additional risk for organizations.
Application risk can present itself in different ways. Enterprises typically add software to their organizations in a three-dimensional manner—1) code that is written by in-house or outsourced development teams, 2) code that is purchased as commercial off the shelf (COTS), and 3) code that leverages third-party libraries and frameworks, embedded code, and/or outsourced code. Vulnerabilities occur in all three of these scenarios, and organizations must have a strategy for application security for all three software types.
The report uses aggregate telemetry data on vulnerabilities from users of Contrast Assess, and on attacks from users of Contrast Protect. In November–December, we found that 32% of applications had at least one serious vulnerability (Critical or High severity). That is the highest that number has been since May–June 2020, and is significantly higher than most months since we started tracking these metrics in mid-2019.
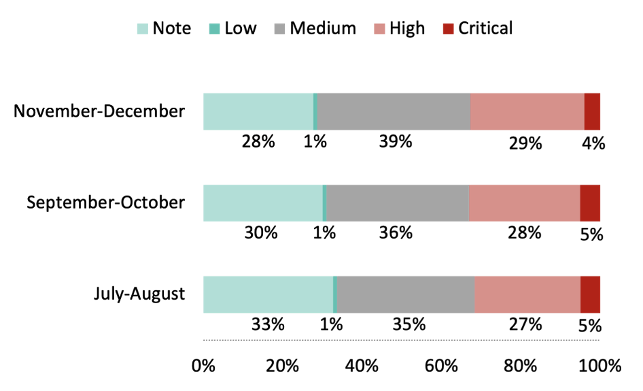
One piece of good news is that the percentage of applications with an excessive number of vulnerabilities—50+ vulnerabilities or 20+ serious vulnerabilities—was down slightly.
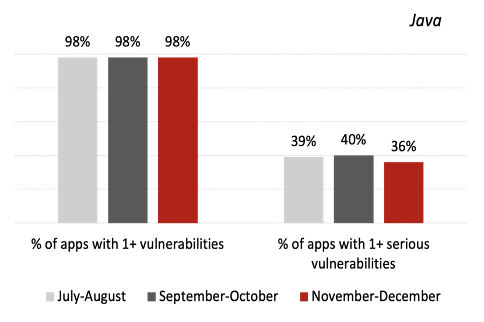
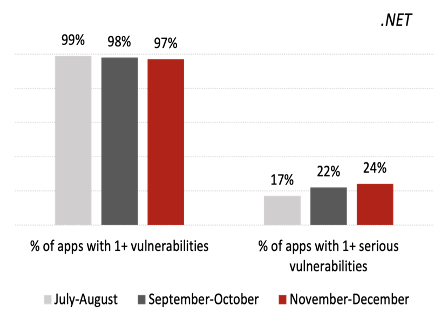
While .NET applications have been less susceptible to vulnerabilities than Java ones since we began tracking these metrics, the gap continued to close in November–December, a trend that has been building for a few months.
For Java applications, the percentage of applications with at least one serious vulnerability declined to 36%—its lowest level in 10 months and significantly below the 12-month average of 42% recorded in late 2019 and early 2020. On the other hand, 24% of .NET applications had a serious vulnerability, up from 22% in the last bimonthly report and 16% in the 12-month average. Organizations often assume .NET is more secure because of its better-managed open-source libraries, but this trend is a reminder that the language cannot be assumed to be safe by default.
Regular readers of our Application Security Intelligence Reports know that the vast majority of attacks are probes—that is, they target a vulnerability that does not exist within a piece of software. Despite this being the case, fluctuations in that number—typically between 97% and 99%—can provide insight into what cyber criminals are doing. While that fluctuation may seem insignificant at first glance, remember that each application receives many thousands of attacks every month, so 1–3% of that total equates to a couple hundred of successful exploits. In November–December, 99% of attacks were probes, suggesting that adversaries were in more of an “R&D mode.”
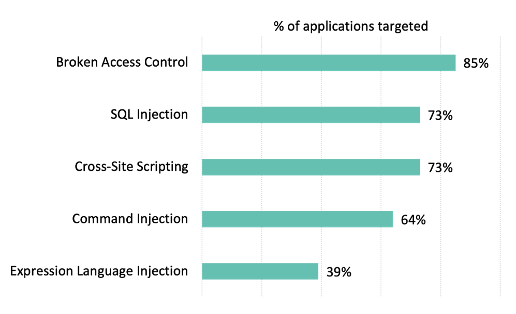
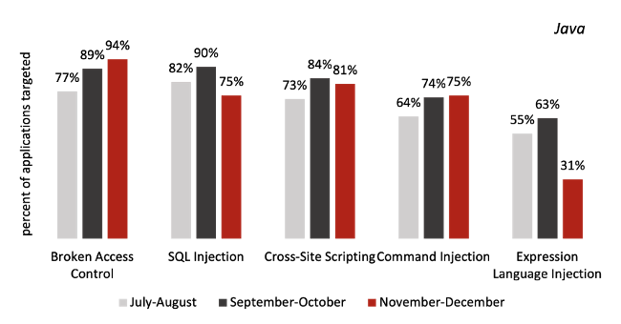
Drilling down to the percentage of applications targeted by specific attack types, the top three (broken access control, SQL injection, and XSS) remained relatively steady from the last report. However, the next two in the top five—OS command injection and Expression Language injection—declined significantly. But it should be noted that each of the top five attack types impacts a larger share of applications than they did in the 12 months ending in May 2020, as reported in the Application Security Observability Report.
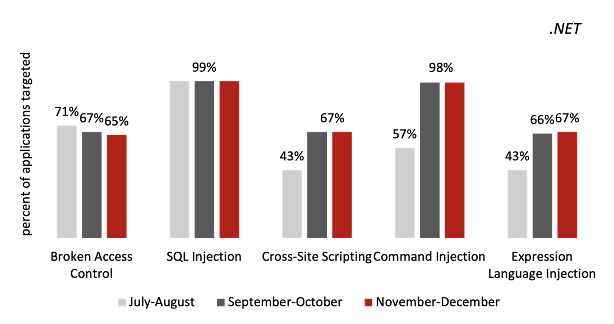
One interesting trend is that some of the top attack types impacted a lower percentage of Java applications. SQL injection attacks impacted just 75% of Java applications in November–December, down from 90% in the last bimonthly period. On the other hand, broken access control attacks impacted 94% of Java applications in November–December—a number that has steadily risen over the past year. While all this was happening on the Java side, the percentage of .NET applications impacted by the most common attack types held steady.
As described in another recent blog, we recently upgraded the Contrast RiskScore Index to Beta version .5, and the scores for 19 different vulnerability types are included in the November–December report. The idea behind the RiskScore Index is to provide a simple, numerical score to help organizations understand the relative risk of different vulnerabilities—and therefore help inform their prioritization strategies.
Broken access control is perennially the most dangerous threat to applications, and this bimonthly period was no exception. It scored 9.67, up slightly from September–October. Cross-site scripting (XSS) remained number two, and SQL injection moved from 5th to 3rd position since our last report.
You can read more about the specific fluctuations on the chart below in the bimonthly report, but I thought three facts were very interesting about this month’s RiskScore Index:
1) The average RiskScore increased slightly, from 5.41 to 5.44. This can be attributed to the increased prevalence of serious vulnerabilities driven primarily by broken access control and XML external entities (XXE) vulnerabilities.
2) Insecure configuration saw the largest drop in vulnerability prevalence, which resulted in a 1.4 drop in RiskScore. This vulnerability category is mostly made up of header injection, event validation disabled, and request validation disabled vulnerabilities.
3) Insecure deserialization had the largest jump in risk score, from 4.46 to 6.31. This is concerning because of the important role deserialization plays in web applications.
-png.png)
By the way, be sure to watch for the release of the open-source version of the Contrast RiskScore Index later this year, with which you can input your own data to calculate an organization-specific RiskScore Index for your unique situation.
The SolarWinds hack is a wake-up call, and the data from this report corroborates it. Organizations of all sizes and in all industries need to make application security a bigger priority in 2021. They need to reduce their security debt and “shift left” to discover vulnerabilities earlier in the process. And they need to focus on ongoing protection of applications in production—in other words, to “shift right.” The best way to do that is with security instrumentation, which embeds continuous security testing and runtime protection within the application.
We all want the coming year to be much more “normal” than the last one. Here’s hoping that the applications at your organization experience that same sense of normalcy in 2021.
Read the Bimonthly Report to gain insights into key vulnerability and attack trends and takeaways from November-December 2020. Also, for additional detail, check our Inside AppSec Podcast interview that also explores findings from the Bimonthly Report.