X
July 23, 2019
What is this report: This report summarizes Contrast Labs' analysis of real world application attack data from June 2019. It utilizes data from attacks that Contrast observed over the previous months and highlights the key trends found.
Who should read this: Developers, product owners and security engineers can use the information to better understand application security threats, adjust their security controls accordingly, and improve their security posture.
Frequency: Through reading this report on a monthly cadence, AppSec teams can gain a better understanding of the possible types and origins of attacks and attackers that you might see.
To learn more about how Contrast directly measures both vulnerabilities and attacks in parallel across your application portfolio, please visit our website.
KEY OBSERVATIONS
SUMMARY
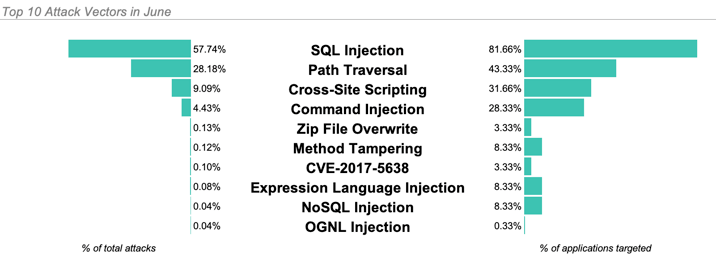
CUSTOM CODE ATTACKS
The three most common attack types in June:
In June, 95% of applications were targeted by one of these three types during the month.
TOP CVE ATTACKS
Exploiting vulnerable versions of Struts 2 continued to be low hanging fruit in June.
CVE-2017-5638 (Struts 2 Input Validation) attacks remained the most prevalent attack on a CVE after two years since being disclosed and the massive attention they received.
After CVE-2017-5638, CVE-2016-4438 (Struts 2 Input Validation) followed as the next most common CVE in June.
CVE-2017-9791 (Struts 2 Input Validation) notably dropped from the top of the list. This Struts 2 CVE made up 47% of CVEs we saw in May, however these attacks fell to almost nonexistent last month.
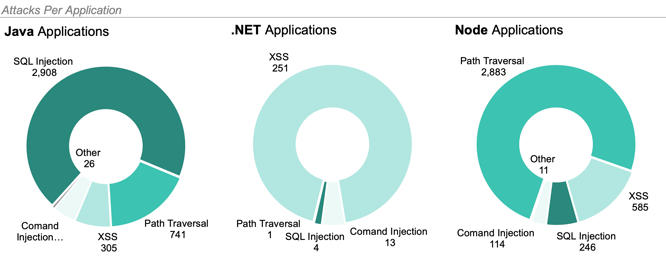
TOP ATTACK VECTORS BY LANGUAGE
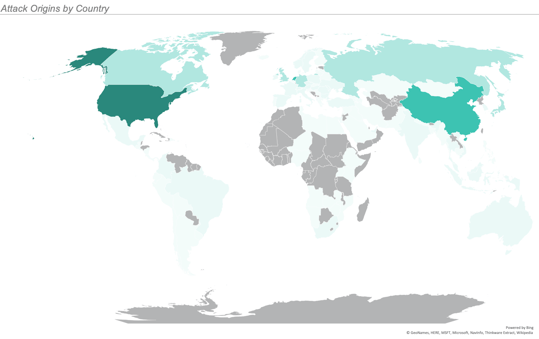
ATTACKS BY GEOLOCATION
June saw attacks from 6 continents and 112 countries. While attacks came from all over the world, the overwhelming majority originated in the United States.
The largest increase in volume came from the Netherlands, where we observed a 2x increase in attacks from May to June.
The map below illustrates the number of attacks originating from each country with the most saturated color representing the most attacks and the least saturated representing the least attacks. We observed no attacks from the countries filled in gray.
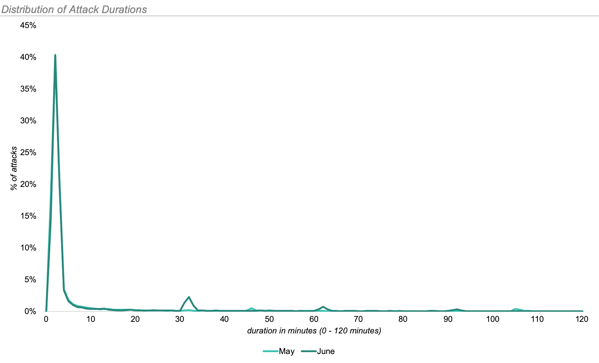
ATTACK DURATION & METHODS
The longest attack in June lasted 3 hours, 2 minutes and 12 seconds. It consisted of 21 separate Reflected XSS attacks.
The average length of attack in June was 10 minutes and 13 seconds, up from just under 2 minutes in May.
The vast majority of these attacks were comprised of only one attack vector.