X
August 4, 2021
Application Security Observability Report Finds that 74% of Code In An Application Is Never Invoked
Digital transformation as a business trend has been accelerating for a decade or more. Organizations have steadily launched digital tools to re-imagine everything from manufacturing operations to customer service, from supply chain management to sales and marketing. The result is a revolution in how customers interact with brands, and how those brands’ products are made and brought to market. Even before COVID-19, laggards in digital transformation were in danger of becoming irrelevant.
Of course, the pandemic accelerated this trend, widening the gap between innovators and laggards. And over the past 18 months, we’ve seen some of the laggards fold up shop—unable to keep pace with innovators that were in a much better position to capitalize on their digital investments. Specifically, when the world suddenly locked down in the spring of 2020, many enterprises needed new customer-facing applications immediately in order to survive. This task fell to already overburdened software engineers—many of whom were newly working from home. The field had already dramatically improved the speed at which it delivered software, but companies needed even more speed from them in that unprecedented time. Two recent Contrast studies found that developers are facing pressure to shorten release cycles at more than three-quarters of organizations.
It is no wonder then, that an increasing percentage of code found in the typical application today comes from open-source libraries and frameworks. Using already-written code for specific functions in a piece of software eliminates the need to “re-invent the wheel” and saves developers considerable time. Indeed, third-party code is a big reason why software developers can crank out applications so much more quickly today than a decade ago.
Yet, using open-source code does bring an additional layer of risk to an organization. The number of new Common Vulnerabilities and Exposures (CVEs) discovered every year in third-party libraries has mushroomed since the database was created in 1999. A record 18,325 CVEs were logged in 2020, and we are on track to exceed that number in 2021.
The increase in new CVEs is driven by a number of factors, including a sharp increase in the number of open-source libraries, the number of vulnerabilities discovered after they were exploited, and the number discovered by security researchers like our own Matt Austin.
Whatever the sources of the new CVEs, the huge number makes simply tracking which CVEs are in a piece of software an overwhelming prospect—let alone remediating them. This is compounded by the overwhelming percentage of code in the typical application that comes from open sources. Looking at thousands of real-world applications across numerous industry segments, the 2021 Application Security Observability Report by Contrast Labs reveals that 80% of the code in a typical application comes from third-party libraries and frameworks.
Percentages in this ballpark are widely discussed these days, and this leaves the impression that organizations with a means for figuring out a way to get on top of their CVEs have solved 80% of their application security risk. Unfortunately, that is not the case, because the 80% figure is not the end of the story.
This is because of the way open-source libraries are structured. As we noted in the Open-Source Security Report earlier this year, a library is often selected because of a single feature that is needed in a new piece of software. However, that library might have other attached libraries that support other functionalities with nothing to do with what the developer needs in the first place. Typical applications, as a result, contain a lot of inactive libraries—libraries that are never touched by the application. The latest telemetry data from all the applications protected by the Contrast Application Security Platform reveals that 49% of the code in the typical application is from inactive libraries.
But even this is not the end of the story, because even within active libraries, not every library class is used by an application. And data from our customer base shows that 25% of the entire code base is from inactive classes within active libraries.
The outtake from the above is that 74% of the code in an application is never invoked, while only 6% of code is from active classes in active libraries. And that 6% looks small indeed up against the 20% of code that comes from custom sources. In fact, if one were to look at the makeup of just the active code in an application—the code that is actually invoked by the software—just 22% of that is from open sources while 78% is custom code.
And since vulnerabilities in inactive code pose zero risk to an organization, it upends the traditional view of many that open-source code is the predominant source of application risk.
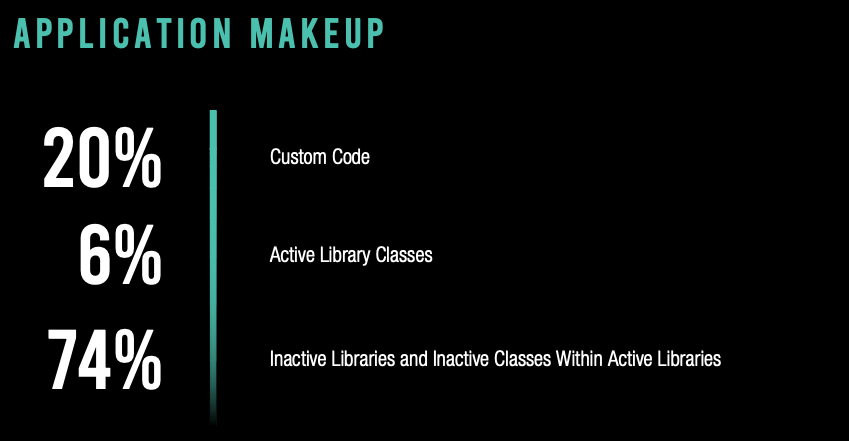
While 80% of the total code in an application is open-source, only 6% is actively used by the application.
Readers who are Contrast OSS users are probably not terribly surprised by these statistics, because they have full visibility into which libraries and library classes are active and inactive, and which CVEs pose significant risk—or any risk at all.
Unfortunately, users of traditional software composition analysis (SCA) tools are not so fortunate. Those solutions do not distinguish between active and inactive libraries and classes, simply reporting each CVE they find according to their severity rating. And if a traditional SCA tool were used with the average application in our dataset, 54% of Critical CVEs and 49% of Major CVEs would be false positives. That is the percentage of CVEs in our customers’ applications that pose no risk because they are in inactive libraries and classes.
The implications of this are serious. Organizations might prioritize a “Critical” vulnerability that poses no risk over a Major CVE that is risky. A delay in dealing with the latter case could result in it being exploited. Additionally, security team members would be wasting countless hours updating libraries that are not even used by the application, or dealing with vulnerabilities in inactive classes of active libraries.
Notwithstanding, library makeup is just a small part of what we reveal in the Application Security Observability Report, Contrast’s flagship annual report on the state of application security. But I think this tidbit is worth calling out for several reasons:
I hope you will download and read the entire report. A few highlights:
REPORT: 2021 Application Security Observability Report
PODCAST: Key Insights on Application Makeup: Custom and Open-source Code (New Report)
WEBINAR (Register): Key Insights and Benchmarks from Contrast’s 2021 Application Security Observability Report
VIDEO: Introducing Contrast’s 2021 Application Observability Report