Contrast Labs' analysis of real world application attack data from January 2018.
Overview
- In January, overall application attack volume just about doubled. Once again this month there were no applications or APIs that were not attacked.
- Once again, the United States dominated the attack landscape, with almost 2x the rest of the world combined. Also, while there was modest growth in attacks on Struts CVEs, the search for zero-day vulnerabilities increased dramatically this month.
- Interestingly, application attacks tend to last only 3 minutes and 27 seconds on average (down from 5 minutes and 15 seconds last month). The longest attack was just over 2 hours.
Observations: Attacks on Custom Code Vulnerabilities
- We are seeing a huge number of automated attacks so be sure that you have appropriate detection and exploit prevention in place. Path Traversal, Cross Site Scripting, and SQL Injection attacks were the three leaders again by a wide margin.
- Method Tampering, CSRF, and Padding Oracle attacks are all on the rise. But the overall numbers are still very low.
Observations: Attacks on Known Vulnerabilities (CVEs)
-
We continue to see a large number of attacks on open source libraries. Many are against Struts2 and other OGNL Injection vulnerabilities. Most increased in January (5638, 9791, 4438, 12616), but others decreased or disappeared (2251, 3081, 0112). You should be sure you're continuously monitoring your libraries, and ensure exploit prevention with RASP.
Observations: Attackers
- January saw application layer attacks from 29 countries, 1497 cities, and 3141 different IP addresses. While attacks came from around the world, they overwhelmingly originated in the United States.
-
Not much change in the countries doing the attacking. The United States, Poland, Netherlands, and France are once again our top four attack leaders. As always, we caution that these numbers are distorted, as attackers may be using hosts in the United States to launch their attacks.
- Congratulations, Chesterfield! Your city is #1 in attack traffic for the past three months straight. And a shout out to Austin!
Top Attack Vectors
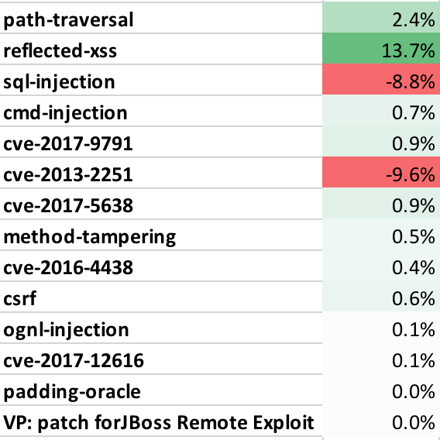
- The following table shows the percentage of applications that were attacked using each different attack vector. This may help you estimate the likelihood of one of your applications experiencing an attack in a month. Note that all applications were attacked during the month.
Table 1. Percentage of Applications Attacked (by Vector) for January 2018 (%, Change)
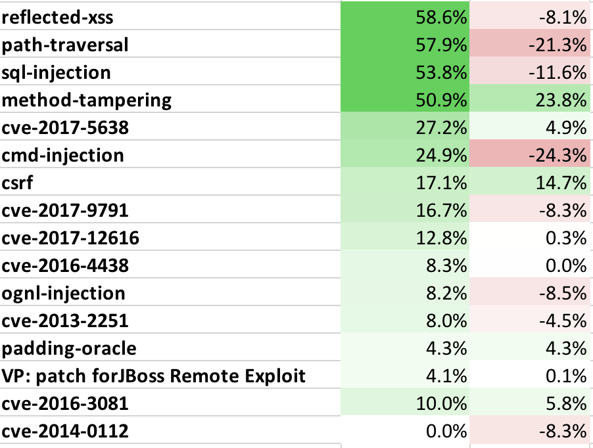
- The following table lists the top attack vectors by volume of attacks, and the percentage change compared to last month. This is intended to give you an idea about both the most dangerous attacks as well as attack vectors that are becoming more or less dangerous.
Table 2. Attack Level Change (by Vector) for January 2018
Attack Geolocation
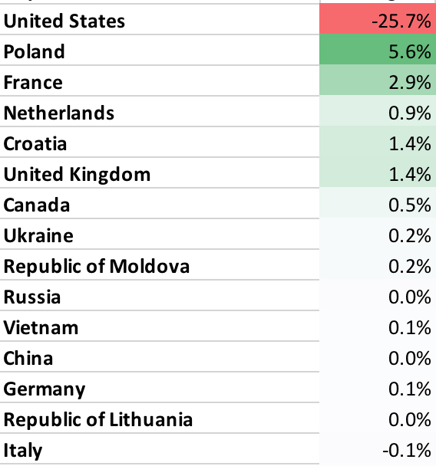
- The following table lists the top countries by attack volume and their change since last month. This may help you understand who might attack your applications, although be aware that many attacks are routed through other countries.
Table 3. Percentage of Attacks, by Country for January 2018 (Change in %)
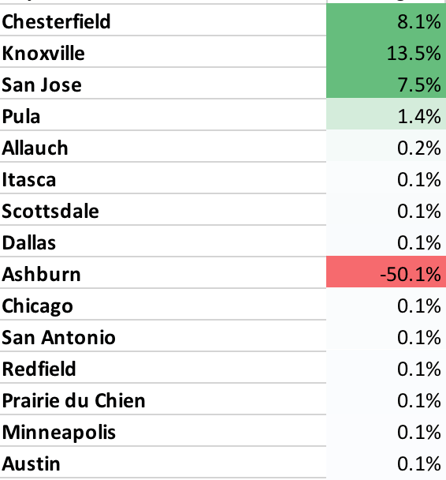
- The following table lists the top cities by attack volume and their change since last month. This may help you understand who might attack your applications, although many attacks are routed through other cites.
Table 4. Percentage of Attacks, by City for January 2018 (Change in %)